Steady solve · Dataset 01
Terminal flows
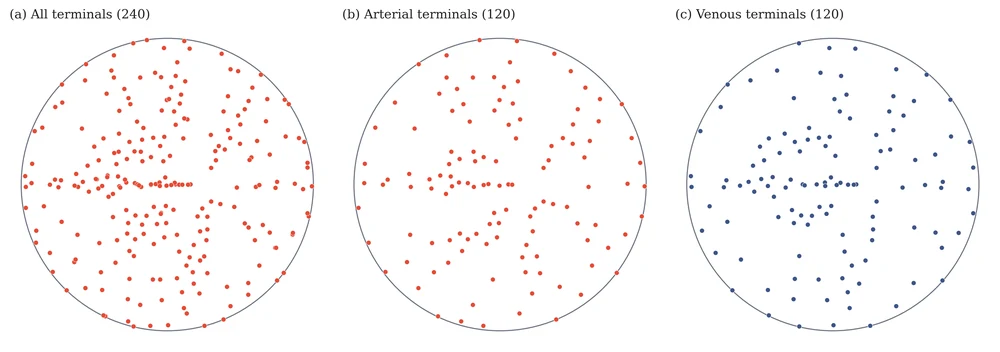
Signed steady flow at all 240 terminals on the projected spherical cap. Positive values are arterial inflow, negative values venous outflow.
Table
Terminal data
Terminal coordinates and signed flows. Positive flow is arterial inflow; negative flow is venous outflow.
| Terminal | Type | x (cm) | y (cm) | Q (µL min⁻¹) |
|---|---|---|---|---|
| 1 | Artery | 0.484983 | 0.187801 | 0.091340 |
| 2 | Artery | -0.454627 | 0.287780 | 0.106810 |
| 3 | Artery | 0.110061 | 1.368712 | 0.109600 |
| 4 | Artery | -1.514175 | 0.234155 | 0.109275 |
| 5 | Artery | 1.471850 | 0.523061 | 0.105660 |
| 6 | Artery | -0.680893 | 1.016171 | 0.100416 |
| 7 | Artery | 0.951339 | 1.083532 | 0.109993 |
| 8 | Artery | -0.063010 | 0.830365 | 0.105772 |
| 9 | Artery | -0.790715 | 0.059235 | 0.109391 |
| 10 | Artery | -0.363615 | 0.017789 | 0.106115 |
| 11 | Artery | -0.304416 | 1.199305 | 0.087120 |
| 12 | Artery | -1.177569 | 0.917605 | 0.113296 |
| 13 | Artery | 0.812453 | 0.457995 | 0.106078 |
| 14 | Artery | 0.177320 | 0.517310 | 0.095741 |
| 15 | Artery | -0.554717 | 0.091180 | 0.106649 |
| 16 | Artery | -0.912035 | 1.349289 | 0.112148 |
| 17 | Artery | 0.224139 | 0.730191 | 0.097124 |
| 18 | Artery | 1.424617 | 0.011849 | 0.102350 |
| 19 | Artery | 0.605585 | 1.465849 | 0.107365 |
| 20 | Artery | 1.103187 | 0.709193 | 0.105709 |
| 21 | Artery | -1.020331 | 0.121738 | 0.102241 |
| 22 | Artery | -0.230750 | 1.616400 | 0.113917 |
| 23 | Artery | -0.184180 | 0.308911 | 0.099480 |
| 24 | Artery | 0.573390 | 0.431578 | 0.094785 |
| 25 | Artery | -0.413915 | 0.900155 | 0.096424 |
| 26 | Artery | -1.399147 | 0.639325 | 0.112658 |
| 27 | Artery | 0.139825 | 0.908490 | 0.098648 |
| 28 | Artery | -0.132601 | 0.006180 | 0.097615 |
| 29 | Artery | -0.957439 | 0.626047 | 0.105192 |
| 30 | Artery | 0.816068 | 0.674688 | 0.099044 |
| 31 | Artery | 1.359835 | 0.902222 | 0.113962 |
| 32 | Artery | 0.042315 | 1.092595 | 0.112233 |
| 33 | Artery | -0.600006 | 1.445596 | 0.115783 |
| 34 | Artery | 0.093851 | 0.669453 | 0.096825 |
| 35 | Artery | -0.298477 | 0.369178 | 0.095409 |
| 36 | Artery | -1.260401 | 0.056306 | 0.116202 |
| 37 | Artery | -0.045441 | 0.261657 | 0.094931 |
| 38 | Artery | -0.341765 | 0.707067 | 0.092125 |
| 39 | Artery | 1.567692 | 0.245160 | 0.105749 |
| 40 | Artery | 0.091565 | 0.003710 | 0.089311 |
| 41 | Artery | 0.188410 | 1.606682 | 0.116657 |
| 42 | Artery | 0.941139 | 0.305931 | 0.092446 |
| 43 | Artery | -0.547386 | 0.370240 | 0.095871 |
| 44 | Artery | -0.572524 | 0.231662 | 0.112327 |
| 45 | Artery | -0.483712 | 1.070300 | 0.101457 |
| 46 | Artery | 1.002885 | 0.489594 | 0.101651 |
| 47 | Artery | -0.281849 | 0.263931 | 0.095923 |
| 48 | Artery | 0.790793 | 1.269231 | 0.112623 |
| 49 | Artery | 0.866537 | 0.844150 | 0.100624 |
| 50 | Artery | -1.522027 | 0.017428 | 0.129859 |
| 121 | Vein | 0.488244 | 0.188165 | -0.088675 |
| 122 | Vein | -0.922774 | 1.167827 | -0.105948 |
| 123 | Vein | -0.474826 | 0.058492 | -0.104238 |
| 124 | Vein | 1.568904 | 0.192653 | -0.116301 |
| 125 | Vein | 0.707004 | 1.291240 | -0.110307 |
| 126 | Vein | -1.592460 | 0.096539 | -0.112626 |
| 127 | Vein | -0.139996 | 1.251109 | -0.098457 |
| 128 | Vein | -0.945163 | 0.032255 | -0.108302 |
| 129 | Vein | -0.597432 | 0.352933 | -0.104096 |
| 130 | Vein | 1.312852 | 0.951559 | -0.113949 |
| 131 | Vein | -0.082275 | 0.432803 | -0.106707 |
| 132 | Vein | -0.283625 | 0.504788 | -0.103909 |
| 133 | Vein | 0.249630 | 1.520390 | -0.115895 |
| 134 | Vein | 0.083033 | 0.020547 | -0.097441 |
| 135 | Vein | -0.184437 | 0.004361 | -0.101966 |
| 136 | Vein | -0.381612 | 1.580598 | -0.114953 |
| 137 | Vein | -1.256018 | 0.869473 | -0.105926 |
| 138 | Vein | 0.676314 | 0.608440 | -0.102982 |
| 139 | Vein | 0.907619 | 0.937634 | -0.109517 |
| 140 | Vein | -0.542472 | 0.570854 | -0.099692 |
| 141 | Vein | -0.674644 | 0.083433 | -0.101807 |
| 142 | Vein | 0.259013 | 0.002348 | -0.089530 |
| 143 | Vein | 0.151734 | 1.008921 | -0.105166 |
| 144 | Vein | -0.770836 | 0.273954 | -0.099192 |
| 145 | Vein | 1.321173 | 0.537800 | -0.107450 |
| 146 | Vein | 0.534628 | 0.377591 | -0.099534 |
| 147 | Vein | 0.629326 | 0.817751 | -0.099577 |
| 148 | Vein | -1.193375 | 0.048413 | -0.109927 |
| 149 | Vein | -0.370141 | 0.371866 | -0.100857 |
| 150 | Vein | 0.189237 | 0.741190 | -0.098250 |
| 151 | Vein | -0.023895 | 0.082757 | -0.093226 |
| 152 | Vein | -0.626878 | 1.275275 | -0.113725 |
| 153 | Vein | -0.716513 | 0.516814 | -0.101491 |
| 154 | Vein | 0.091120 | 1.216367 | -0.111320 |
| 155 | Vein | -0.268632 | 0.634814 | -0.097601 |
| 156 | Vein | 1.047938 | 1.229904 | -0.116901 |
| 157 | Vein | -0.040332 | 1.529918 | -0.115412 |
| 158 | Vein | -1.484674 | 0.599954 | -0.107604 |
| 159 | Vein | -0.036372 | 0.536156 | -0.107408 |
| 160 | Vein | 0.485414 | 0.556369 | -0.106127 |
| 161 | Vein | -0.337357 | 0.002111 | -0.106828 |
| 162 | Vein | -0.426469 | 0.478597 | -0.110914 |
| 163 | Vein | 1.145392 | 0.336411 | -0.104206 |
| 164 | Vein | -0.157898 | 0.526097 | -0.096536 |
| 165 | Vein | 0.026965 | 0.322275 | -0.089395 |
| 166 | Vein | -0.894203 | 0.214050 | -0.113496 |
| 167 | Vein | 0.789211 | 0.771880 | -0.106257 |
| 168 | Vein | -0.437030 | 0.969241 | -0.095120 |
| 169 | Vein | -0.818023 | 0.426630 | -0.112375 |
| 170 | Vein | 0.074412 | 0.819726 | -0.094157 |
Scroll horizontally to see all columns
Showing 50 arterial + 50 venous rows of 240. Download the CSV for all 240 rows.
Figures
Figures